Built to Last
2025 Annual Investor Report
Since our founding in 2005, the Charter School Growth Fund (CSGF) has focused on growing more great public charter schools. We began with a portfolio of five networks that served less than 20,000 students. Now, 20 years later, CSGF supports a portfolio of 200 public charter school networks in over 30 states and territories, reaching 835,000 students across the country.
Each network in our portfolio is creatively tackling challenges and generating solutions to ensure students have access to a high-quality education that sets them up for long-term success. Our 2025 annual report highlights how leaders fostered responsive growth, pursued a vision for excellence, modeled continuous evolution, and inspired generational impact by investing in schools and networks that are built to last.
Responsive Growth
Growth across the CSGF portfolio reflects a clear priority: expanding access to high-quality public education through sustainable models that meet the needs of students and families who are traditionally underserved.
In 2025, CSGF invested in more than 50 networks, representing the largest year of growth commitments in our 20-year history. This milestone reflects both the sustained demand for high-quality public charter schools and CSGF’s commitment to supporting strategic growth that is grounded in excellence. With this momentum, the CSGF portfolio is firmly on the path to serving 1 million students by 2030.
Across the portfolio, leaders consistently framed growth as a response to families asking for more: more access, more choice, and more schools that deliver strong outcomes and lasting impact for students.
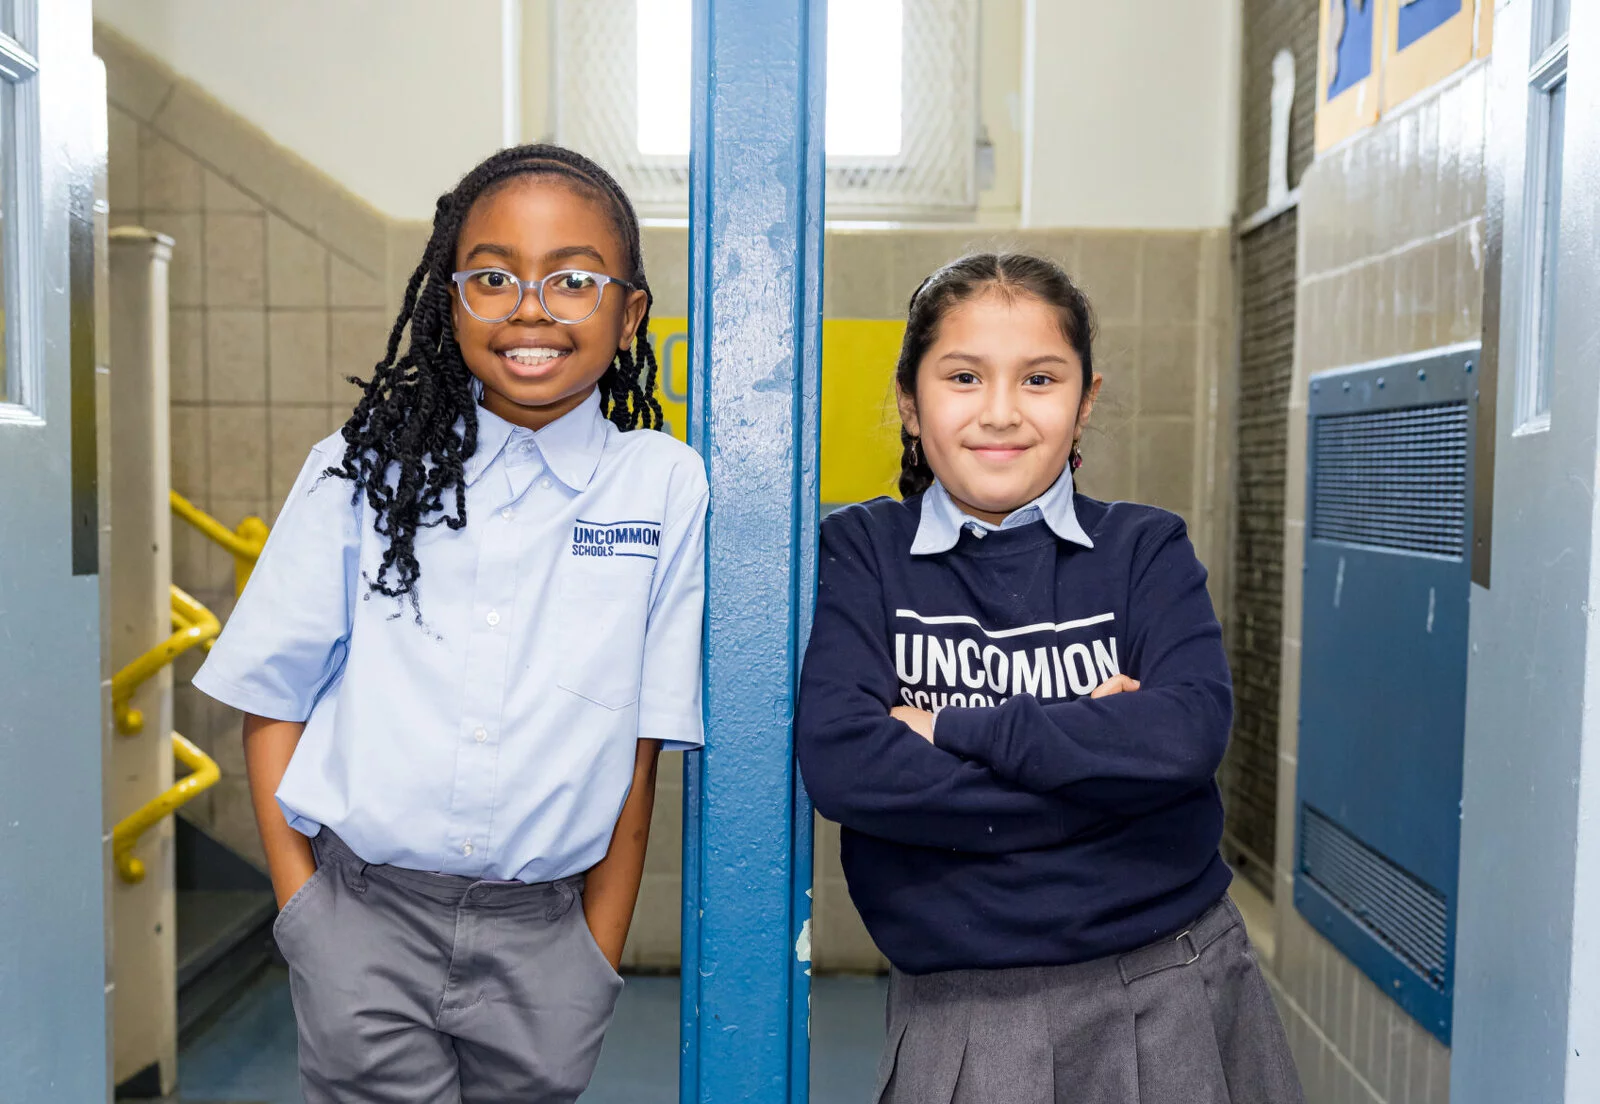
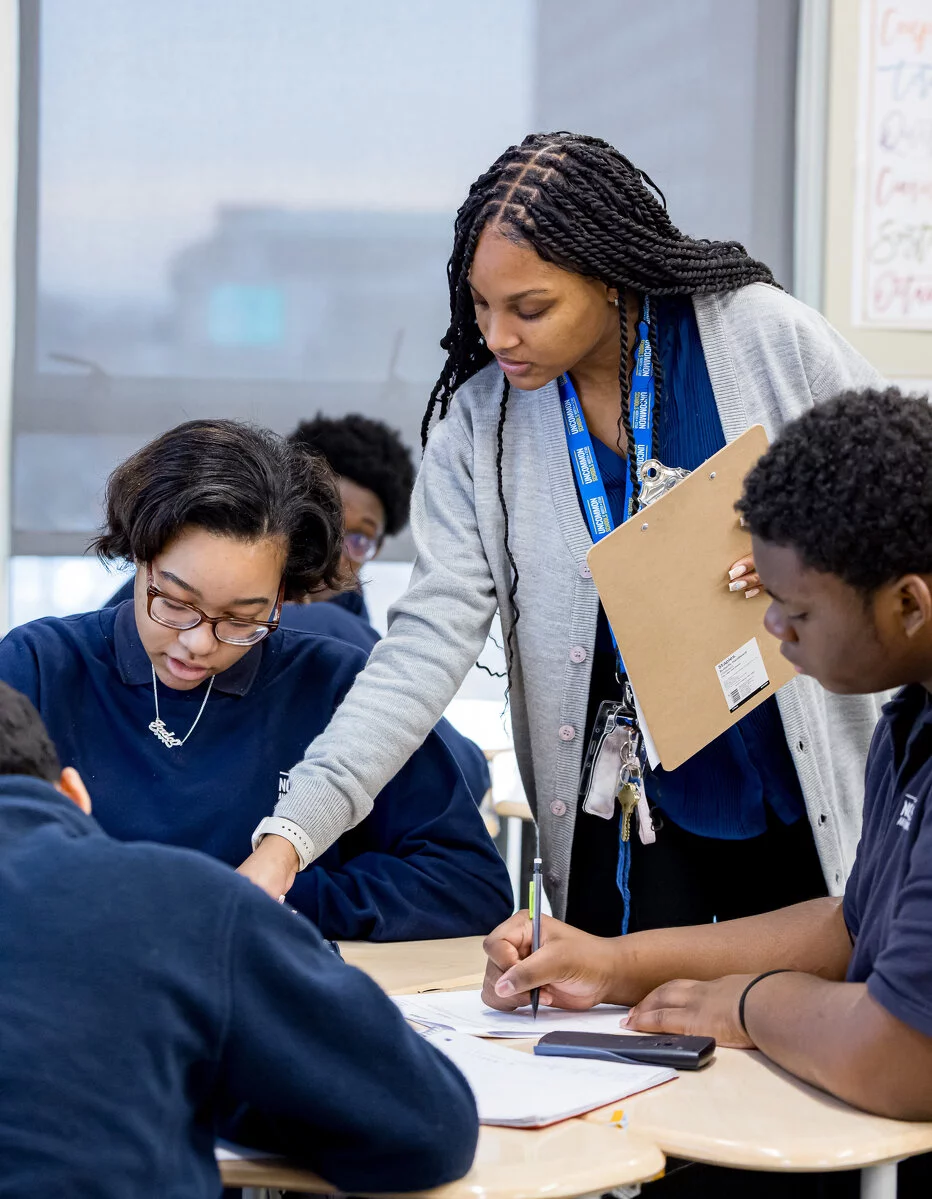
One example is Uncommon Schools, among the first networks to receive a CSGF investment and now one of the largest, operating 52 schools serving 20,000 students. In 2025, CSGF made a significant re-investment in Uncommon’s next phase of growth, adding eight schools across New York, New Jersey, and Massachusetts. With a long track record of strong academic results, Uncommon’s expansion reflects a belief shared by many long-standing portfolio leaders: it is possible to grow larger while continuing to get better.
“I’m very pleased with [our growth] because that is a strong indicator of the need in our community, and that’s what we’re all about.”
Dr. Martin Nalls, Head of School, i3 Academy
That same principle is evident at Harmony Public Schools in Texas, which continues to meet extraordinary family demand in exurban and other fast-growing communities with more than 100,000 students on waiting lists for its 61 campuses across the state. CSGF provided a new commitment to support Harmony’s ambitious plan to open more than 20 new schools by 2030, reaching 15,000 additional students.
CSGF also supported growth among younger networks bringing high-quality options to communities with fewer choices. Thrive Center for Success in Texas, the state’s first autism-focused public charter school, is expanding to meet significant family demand for inclusive, specialized learning environments. Similarly, i3 Academy in Alabama emphasizes a student-centered curriculum — integrating STEM, arts, and personalized learning to foster autonomy — that aims to prepare students for college and careers.
“We’re not trying to do what works in one classroom…we have 20,000 students. We are trying to build excellence at scale. And when you are trying to build excellence at scale, you need a clear vision.”
Julie Jackson
co-CEO Uncommon Schools
20x
students enrolled in Uncommon since 2005
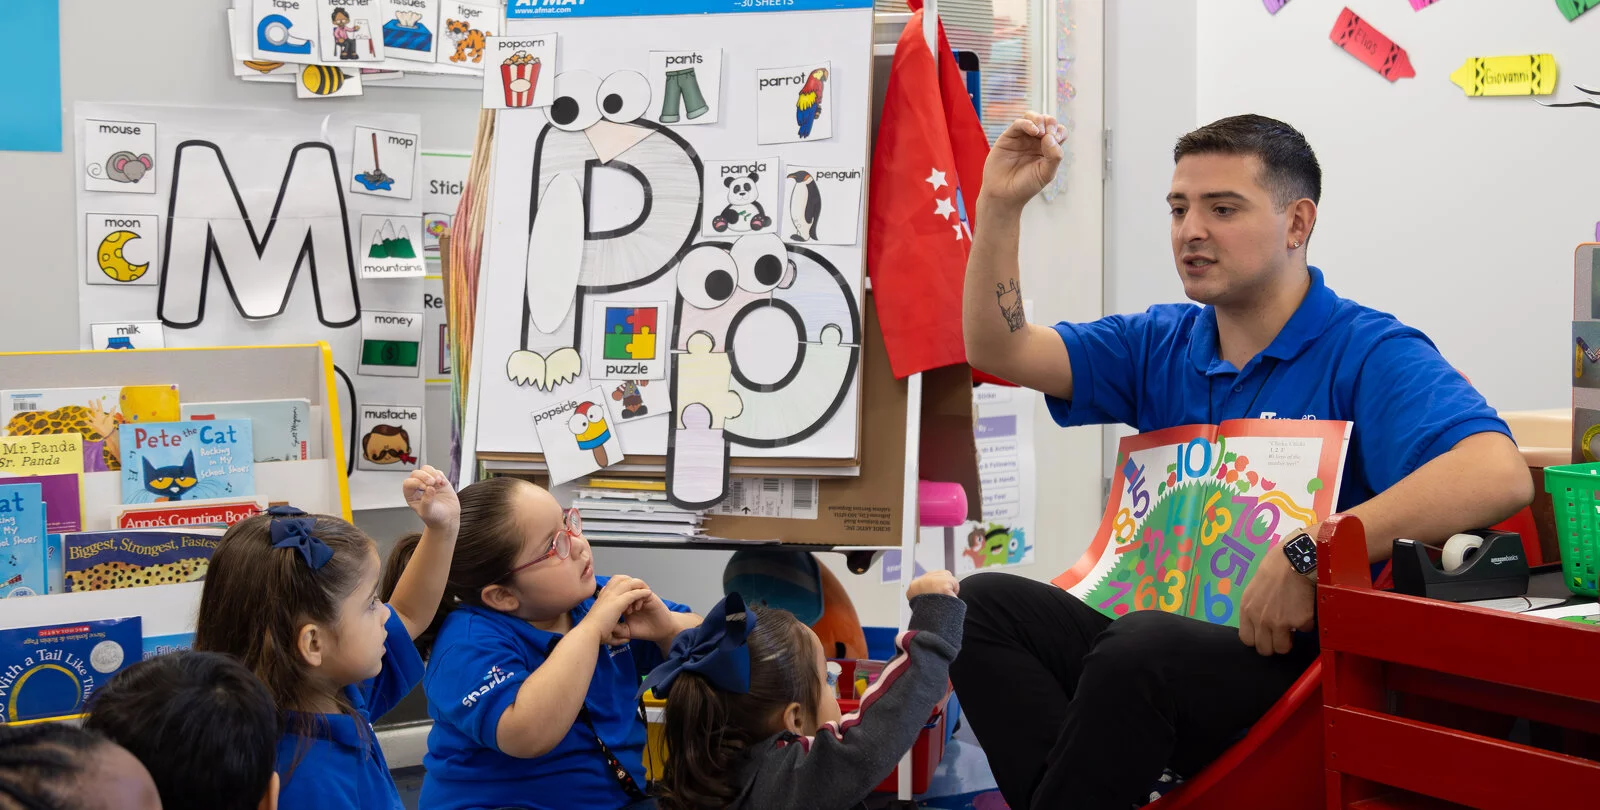
Vision for Excellence
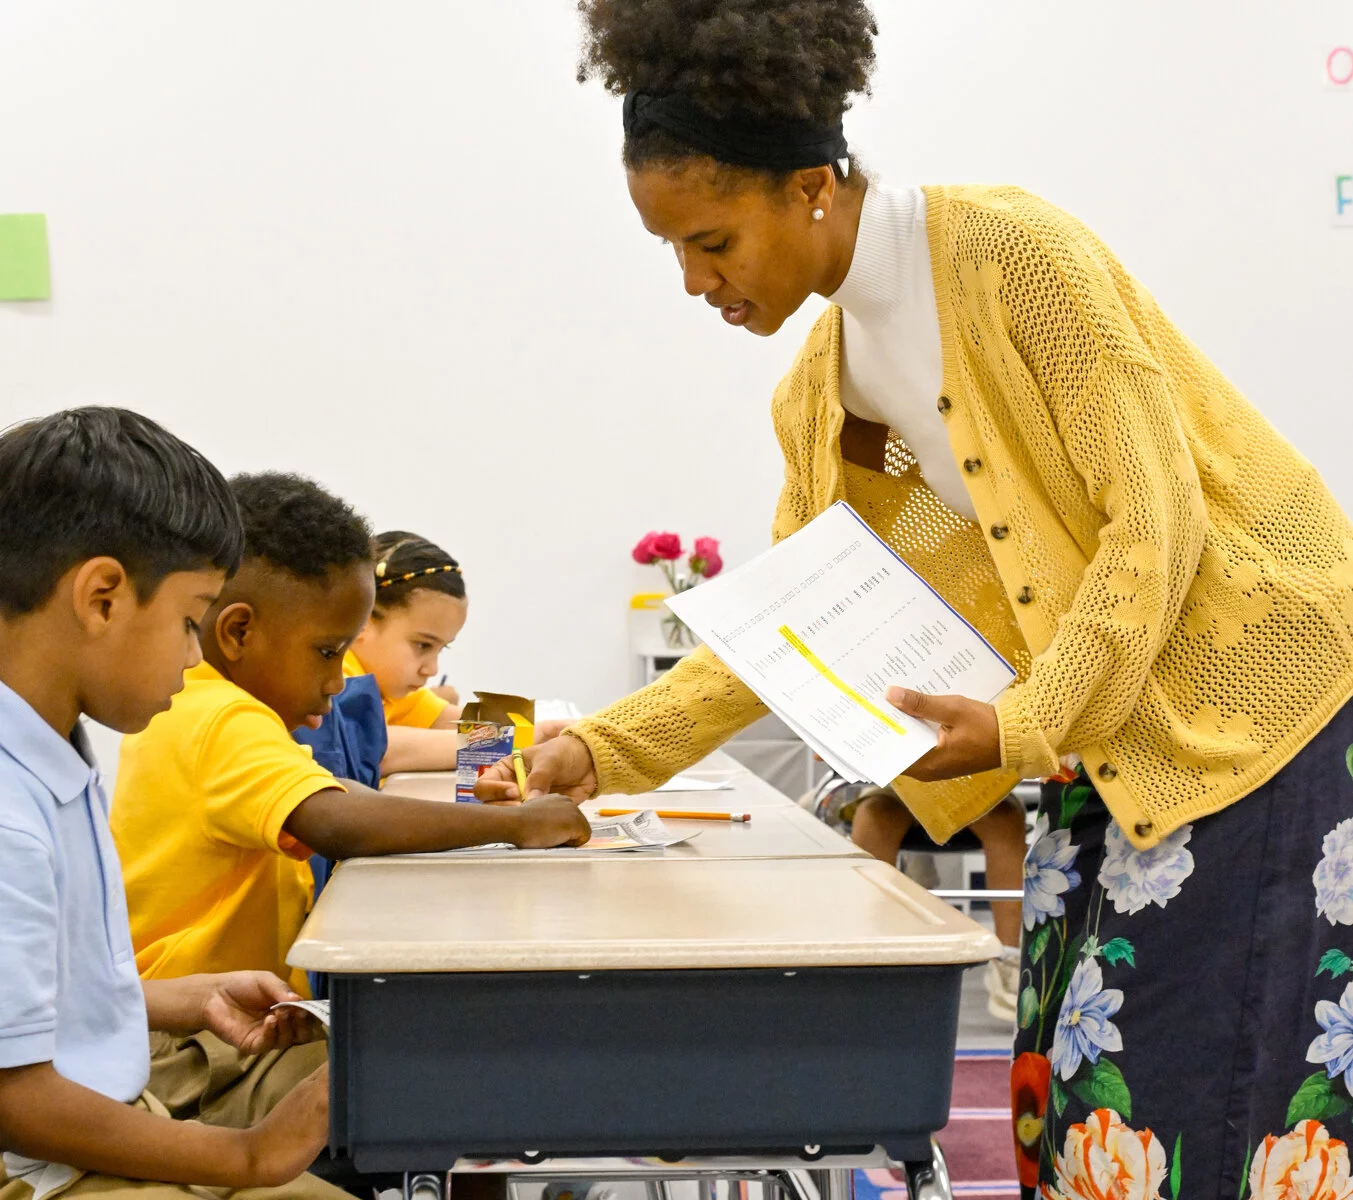
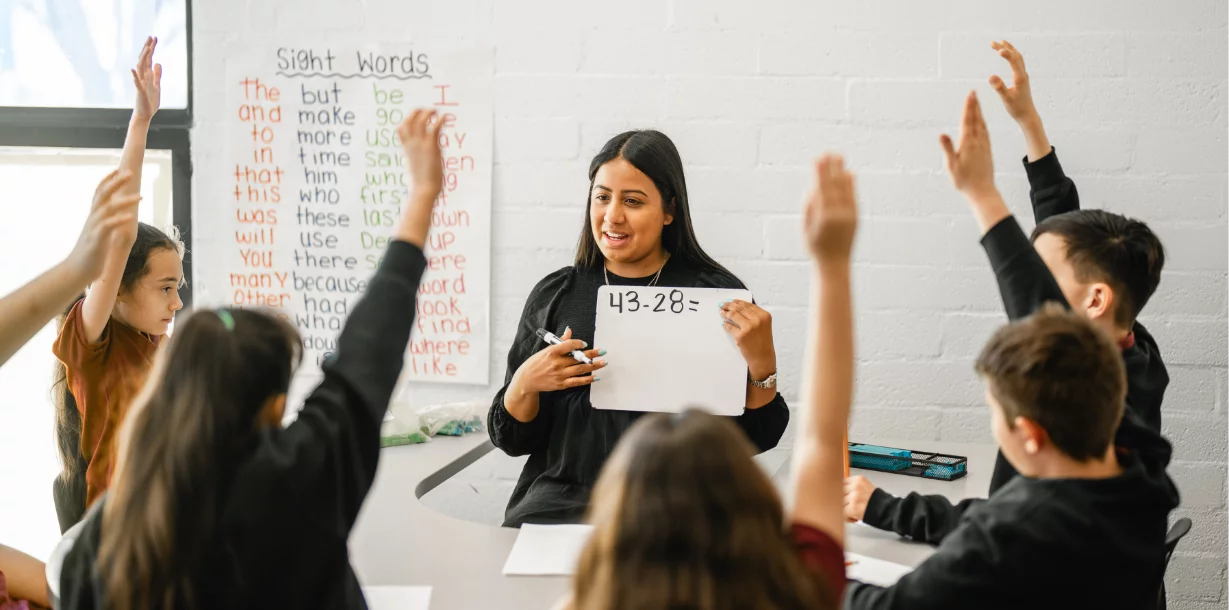
Through intentional character- and culture-building and disciplined academic practice, CSGF-supported schools are setting a clear vision for excellence and consistently delivering strong results.
Excellence across CSGF’s portfolio is grounded in a shared belief that strong culture makes everything else possible. CSGF invests in schools and networks where high expectations are paired with deep care and strong relationships. This culture of excellence supports academic achievement, whole-person development, and long-term organizational health.
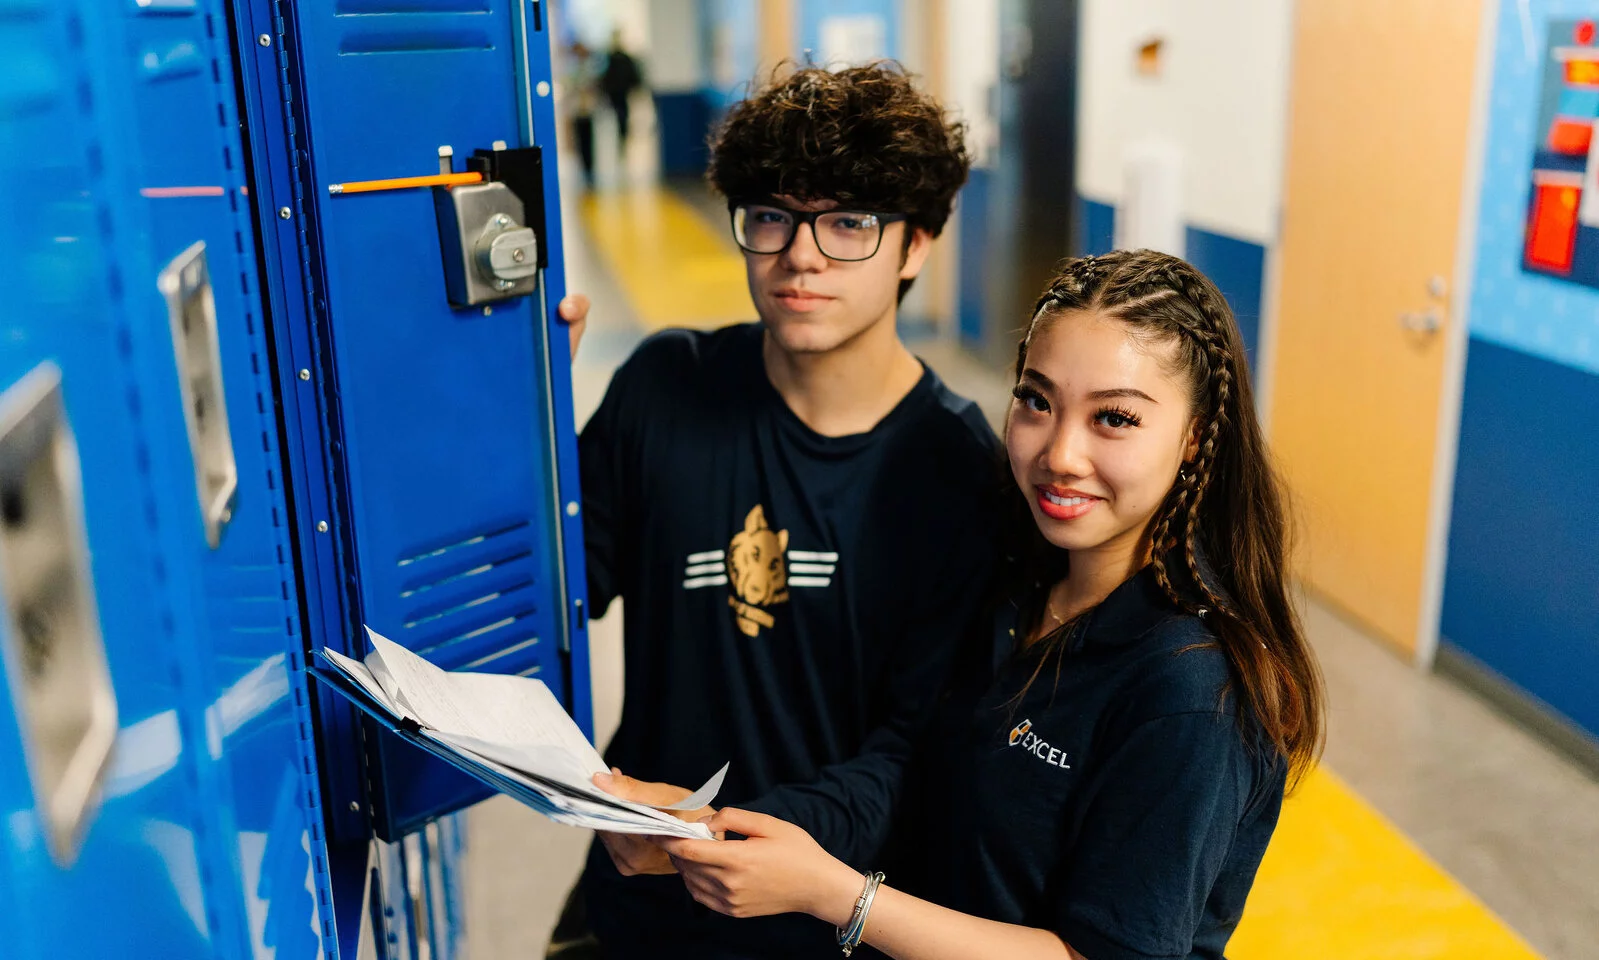
Excellence Community Schools, a three-time National Blue Ribbon School recipient, exemplifies this approach. With a new investment from CSGF, Excellence will extend their reach, working to serve 50% more students in the Bronx, New York. In Rhode Island, Excel Academy Charter Schools has established and maintained a high bar for what is expected of both students and adults while ensuring the work remains deeply relational rather than transactional. This approach has created remarkable stability: over 10% of Excel’s current staff are alumni who have grown into leadership roles.
With a new investment from CSGF, TMSA Schools will demonstrate how excellence can scale across North Carolina’s Charlotte, Triad, and Triangle regions with strong proficiency and growth across student subgroups, adding four K–8 campuses and expanding existing schools to reach an additional 5,600 students. Similarly, Atlas Public Schools in St. Louis is building excellence from the ground up as an early-stage network by pairing a year round calendar with a co-teaching model that is helping students connect rigorous academics to real-world learning in their community.
“We need more communities right now that are grounded in values of striving for excellence and holding each other accountable. I think Excel is one of those places, I feel proud to be a part of that.”
Owen Stearns
CEO, Excel Academy Charter School

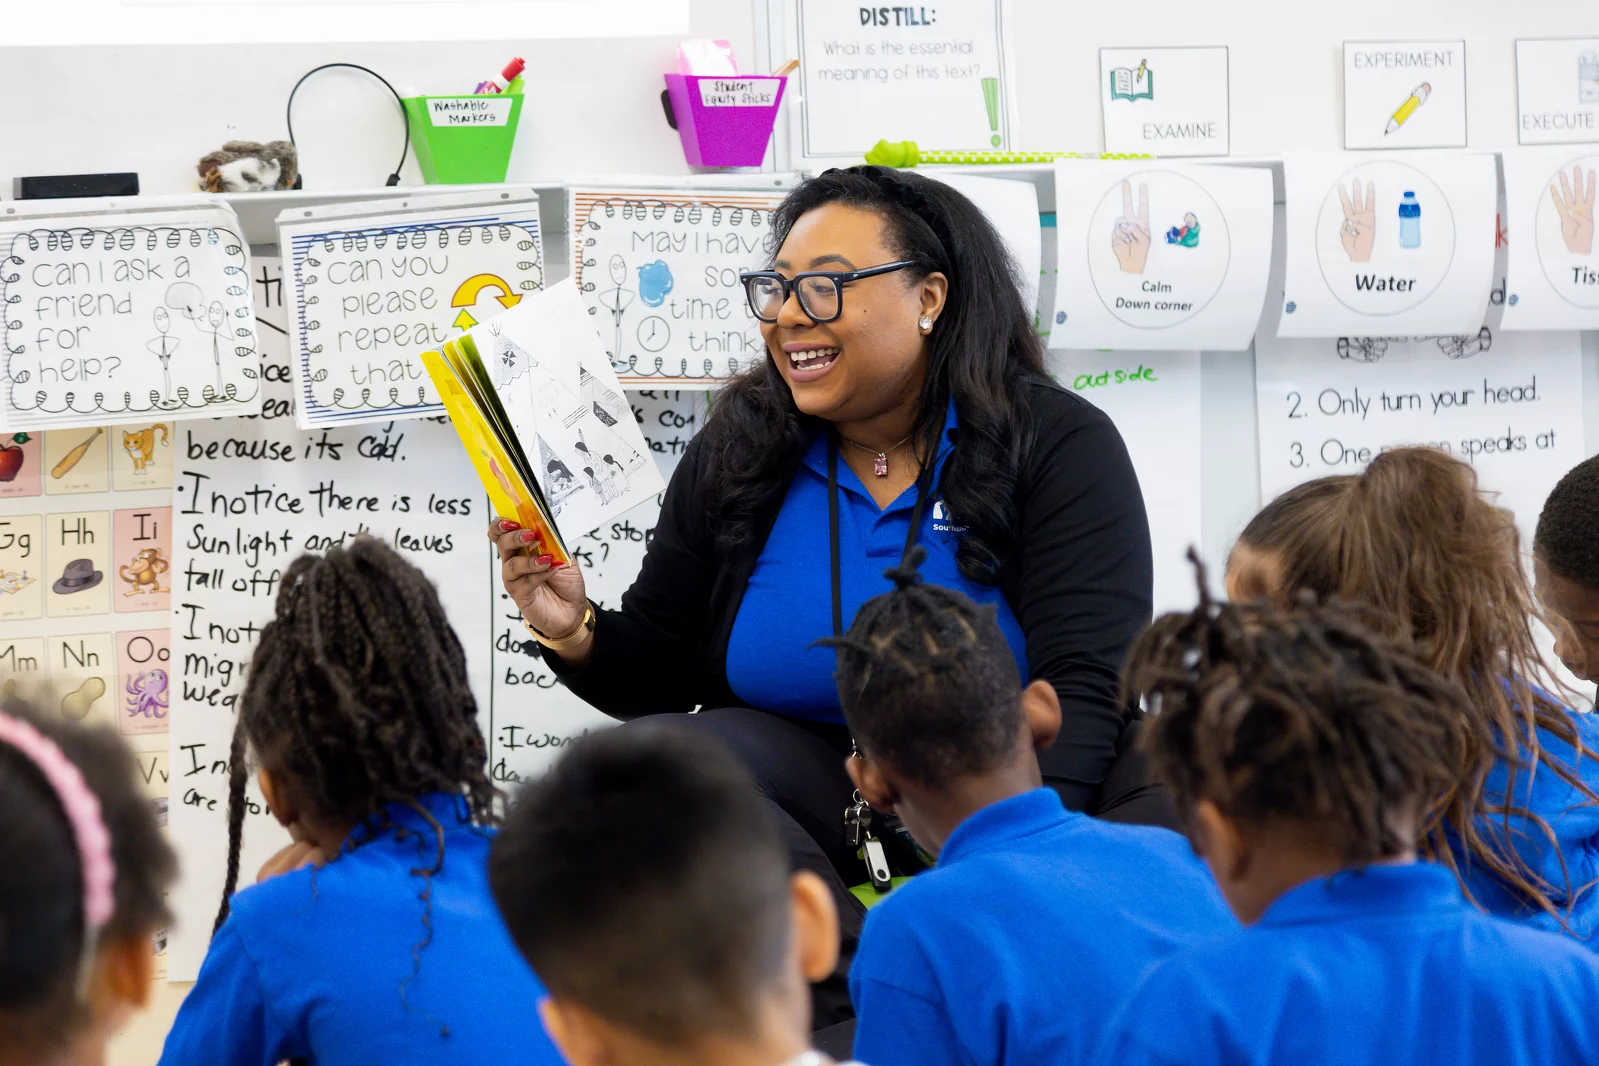
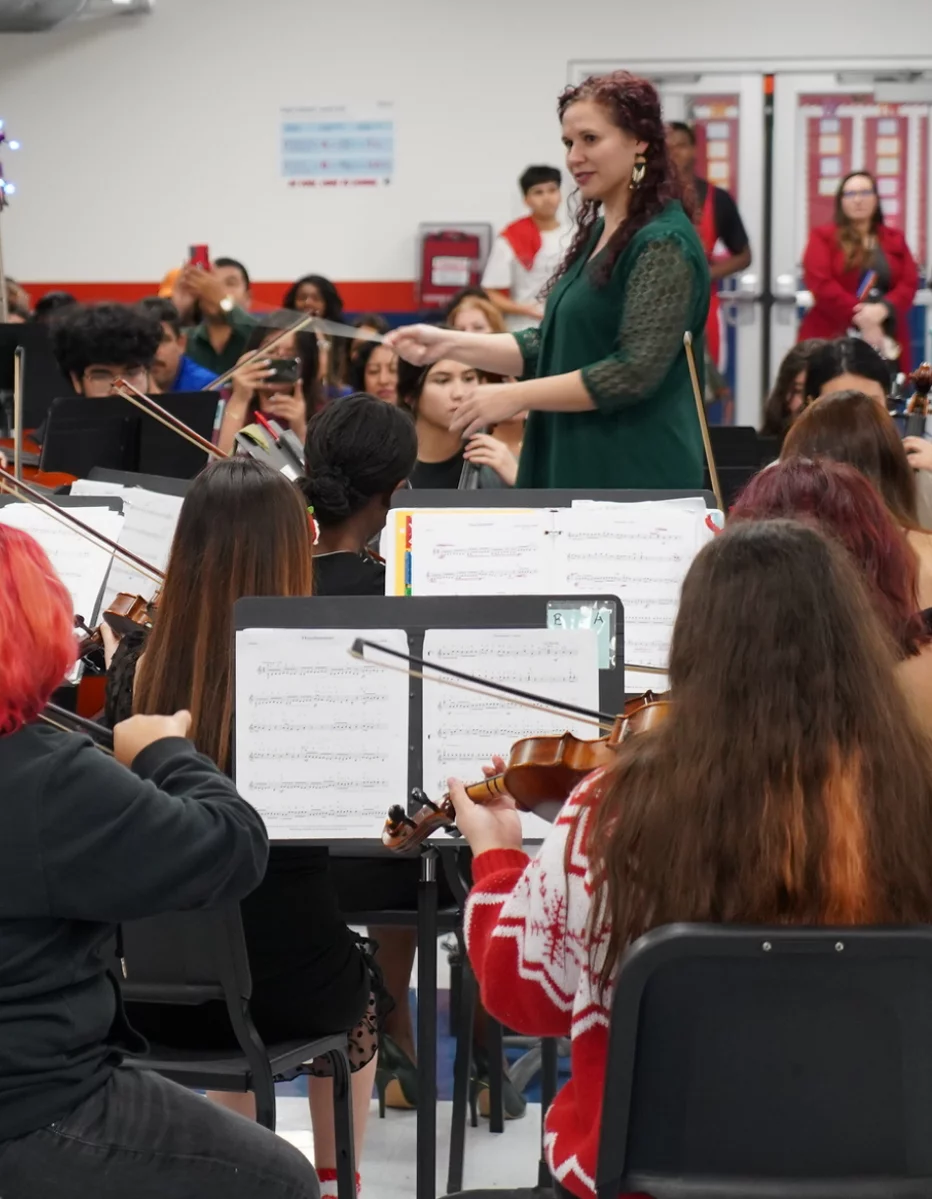
Literacy Learning Community
In 2020, CSGF created an early literacy learning community for network leaders interested in incorporating and strengthening science of reading-based literacy practices into their schools. By facilitating structured collaboration — hosting visits for leaders to see practices in action and providing access to strategic support and tools — CSGF has helped leaders bring their early literacy visions into inspiring, research-based classrooms producing meaningful outcomes for students.
Impact Public Schools in Seattle has participated in this collaborative for several years, working to evolve their literacy curriculum and practices to fully align with the evidence-backed practices associated with the science of reading. With a new investment from CSGF, they will add grades 6-12 to each of their four existing elementary schools by 2030. At Impact’s Black River Elementary School, 82% of kindergarteners met their reading goals in the 2024-25 school year, which is 26% higher than national data.
Continuous Evolution
The best schools never stand still. CSGF-supported networks are building organizations that continuously evolve by testing new approaches and refining their models to meet students' changing needs.
In education, standing still means falling behind. CSGF invests in leaders who are continuously evolving their networks by rethinking long-held practices, piloting new technologies, and expanding models that better serve students and families.
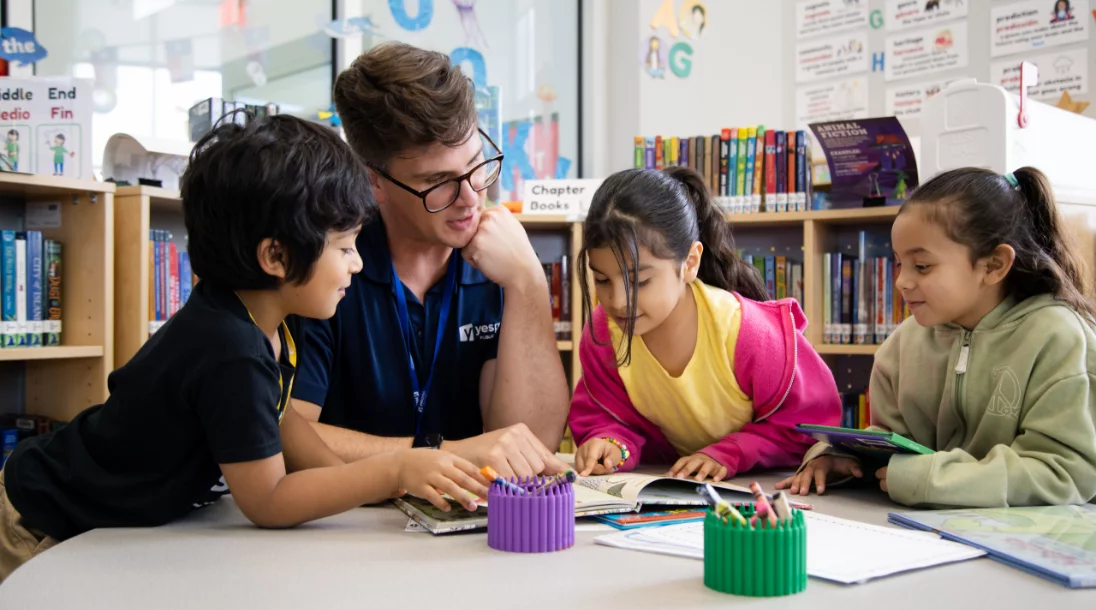
YES Prep Public Schools in Houston exemplifies this mindset. Historically a 6–12 network, YES has begun evolving its model to include elementary schools, creating a full K–12 continuum for students and families. With 27 campuses serving just under 21,000 kids, YES is building on its strong secondary foundation to ensure students enter middle school better prepared, strengthening long-term outcomes through intentional, phased expansion ensure students enter middle school better prepared, strengthening long-term outcomes through intentional, phased expansion.
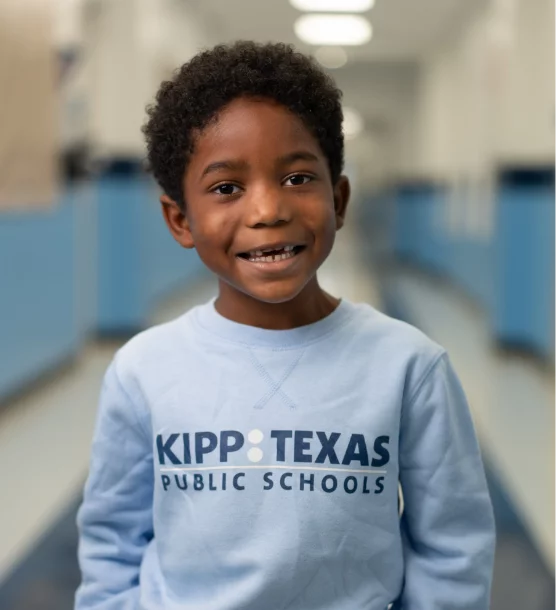
A few years ago, KIPP Nashville adopted a science of reading approach with support from CSGF, training all teachers and setting an ambitious goal: move from less than 30% of K-4 reading at or above grade level to 75%. This past year, KIPP Nashville hit 79% — surpassing their original target and setting a new goal of 90% — and the network is continuously refining its instructional practices to accelerate student achievement.
In 2017, the Mobile Area Education Foundation (MAEF) opened Alabama’s first charter school — ACCEL Day and Evening Academy — which was designed to serve students through credit recovery and flexible programming that recognizes their potential rather than their setbacks. Within three years of opening, ACCEL ranked first in academic achievement among high-poverty high schools and first for academic growth. Building on this success, MAEF is expanding its impact with Ignite Academy for Advanced Careers, approved to open in August 2027 with a focus on career preparation in advanced manufacturing and health care.
5
new YES elementary schools planned by 2030

“In 2020, we had no elementary schools. Today, 25% of our students are elementary, and we’re on a path for that to be half [of our students] in just a few years.”
Mark DiBella
CEO, YES Prep Public Schools
Harnessing the Power of AI
Some of the most promising developments across CSGF’s portfolio involve leveraging artificial intelligence (AI) to solve persistent challenges.
Navigator Schools in central California piloted Paloma, a CSGF-supported AI tool that enlists parents as teaching partners by providing customized tutoring scripts based on each student’s reading level. Among families who completed at least three tutoring sessions per week, the results were striking: students accelerated their reading growth by 49%, while English Learners accelerated growth by 189%.
These outcomes reflect Navigator’s broader commitment to innovation and excellence. The network consistently delivers exceptional results for high-needs students, ranking in the top 20% of all California schools while serving 66% socio-economically disadvantaged students.
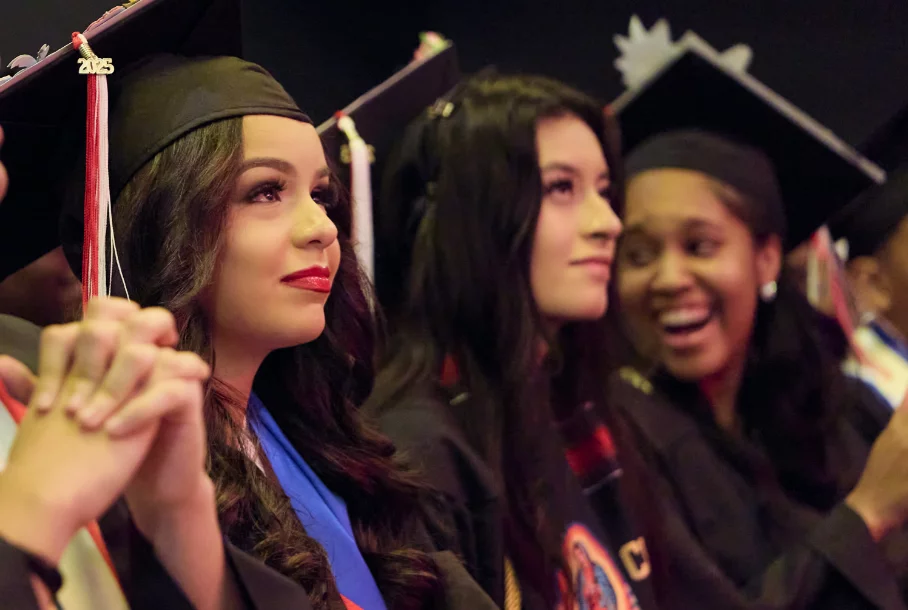
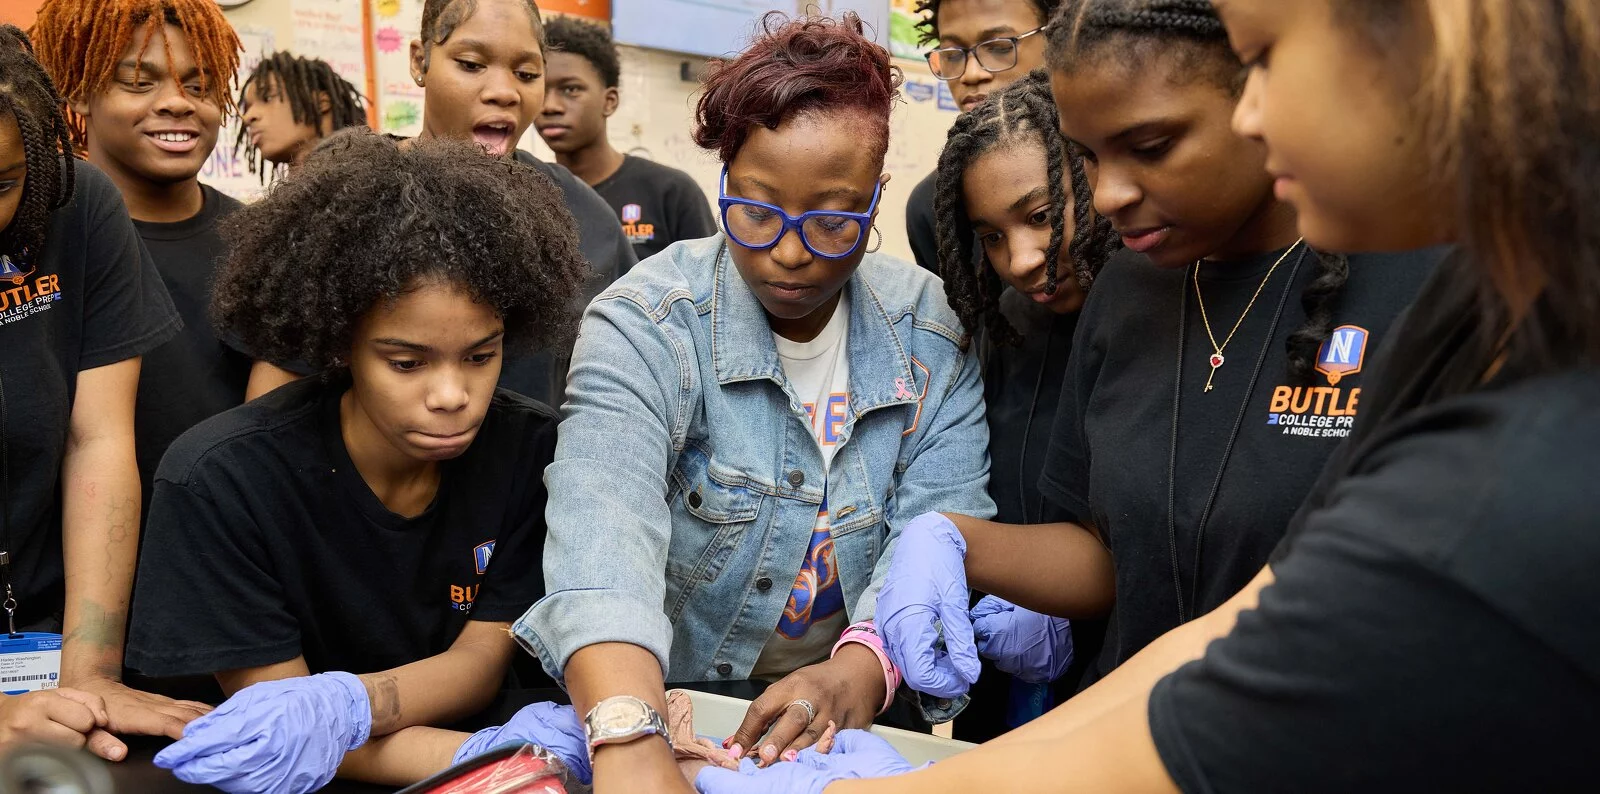
Generational Impact
CSGF invests in networks building lasting legacies through deep community roots, alumni leadership pipelines, and models that are designed to endure. The strongest schools don't just change individual student pathways, they transform entire families and communities for generations to come.
Generational impact means thinking beyond a single student’s experience to consider how education can reshape the trajectories of entire families and communities. Schools and networks across CSGF’s portfolio are building this kind of lasting change by staying deeply connected to the communities they serve and creating pathways for graduates to return as leaders.
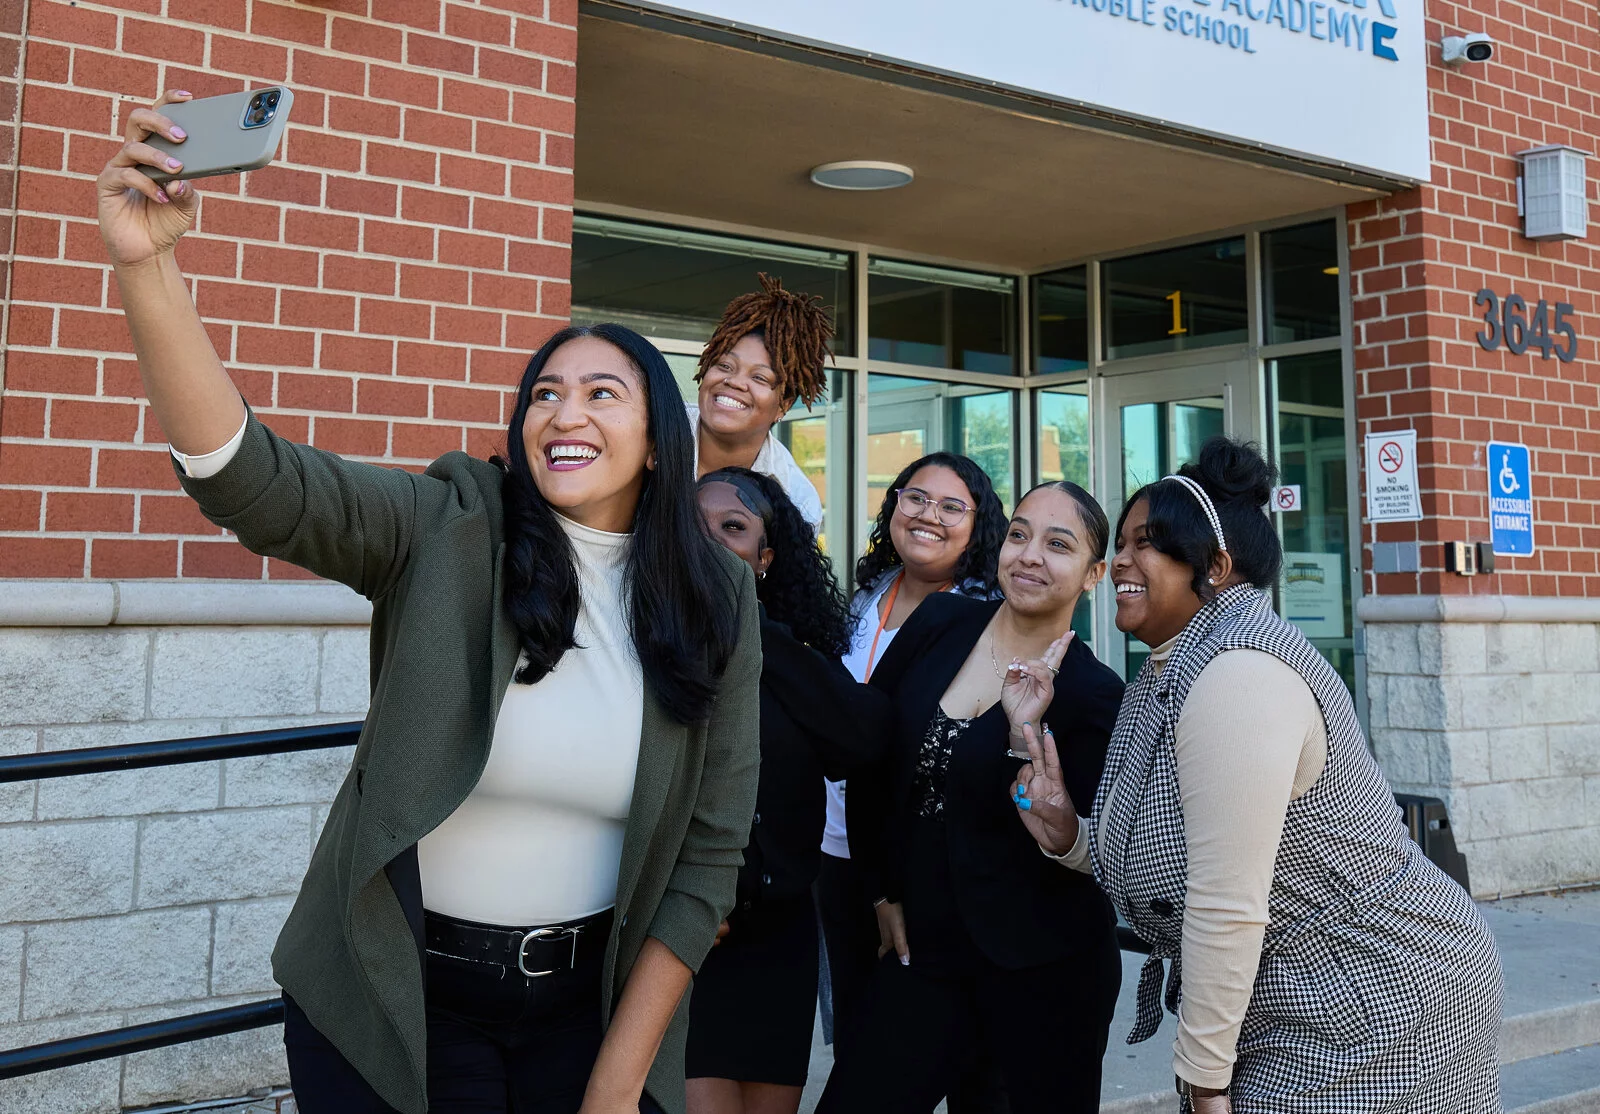
“I was a part of Noble’s first graduating class, and now I have the privilege of leading an organization that changed my life and that continues to transform the lives of students across the city.”
Brenda Cora
CEO, Noble Schools
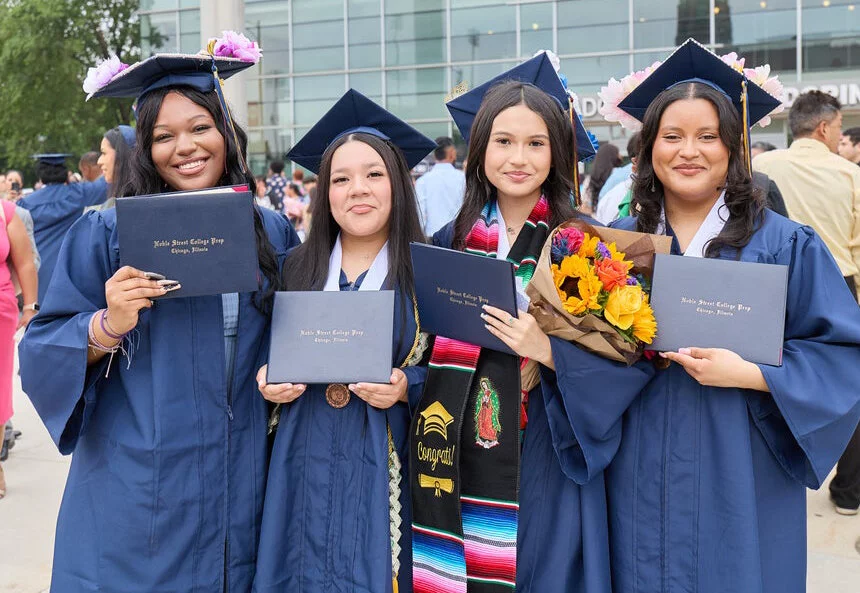
31K+
Noble graduates since 2005
Noble Schools in Chicago exemplifies this commitment. Since 1999, Noble has grown to serve over 12,000 students across 17 campuses, which is nearly 30 times the number of students they served as a single site 25 years ago. The ultimate measure of generational impact may be leadership succession: Brenda Cora, Noble’s current CEO, was part of the network’s first graduating class. Her journey from student to leader demonstrates what’s possible when schools develop talent from within their own communities.
DREAM in New York City has similarly embedded generational thinking into its model, serving 3,000 K-12 students and offering six years of post-secondary support. This year, for the first time, a DREAM high school graduate returned to teach at the network, which represents an exciting evolution of students becoming teachers and education leaders.
“This is generational work. We will see our young people in decision-making seats, and they will be the leaders our next generation looks up to.”
Eve Colavito, co-CEO, DREAM
Schools like Albuquerque Collegiate in New Mexico and Yuba River Charter School in California demonstrate how generational impact emerges through different but equally intentional approaches. Albuquerque Collegiate has relentlessly focused on literacy and curriculum redesign to build strong academic foundations, driving their ELA proficiency to the 95th percentile. Yuba River, California’s first public Waldorf charter school, is weaving environmental stewardship and watershed studies throughout its curriculum to cultivate academic excellence and community responsibility in students from all backgrounds.


CSGF has helped to dramatically grow the number of high-quality public charter schools.
Since our launch in 2005, CSGF’s portfolio has grown to serve 40 times more students. Today, our schools are reaching 835,000 students across the country.

Our portfolio spans 1,200 schools across 34 states and territories as of the end of the 2024-25 school year.
The map below indicates the number of CSGF-supported public charter schools operating in each state in 2005 and in 2025.
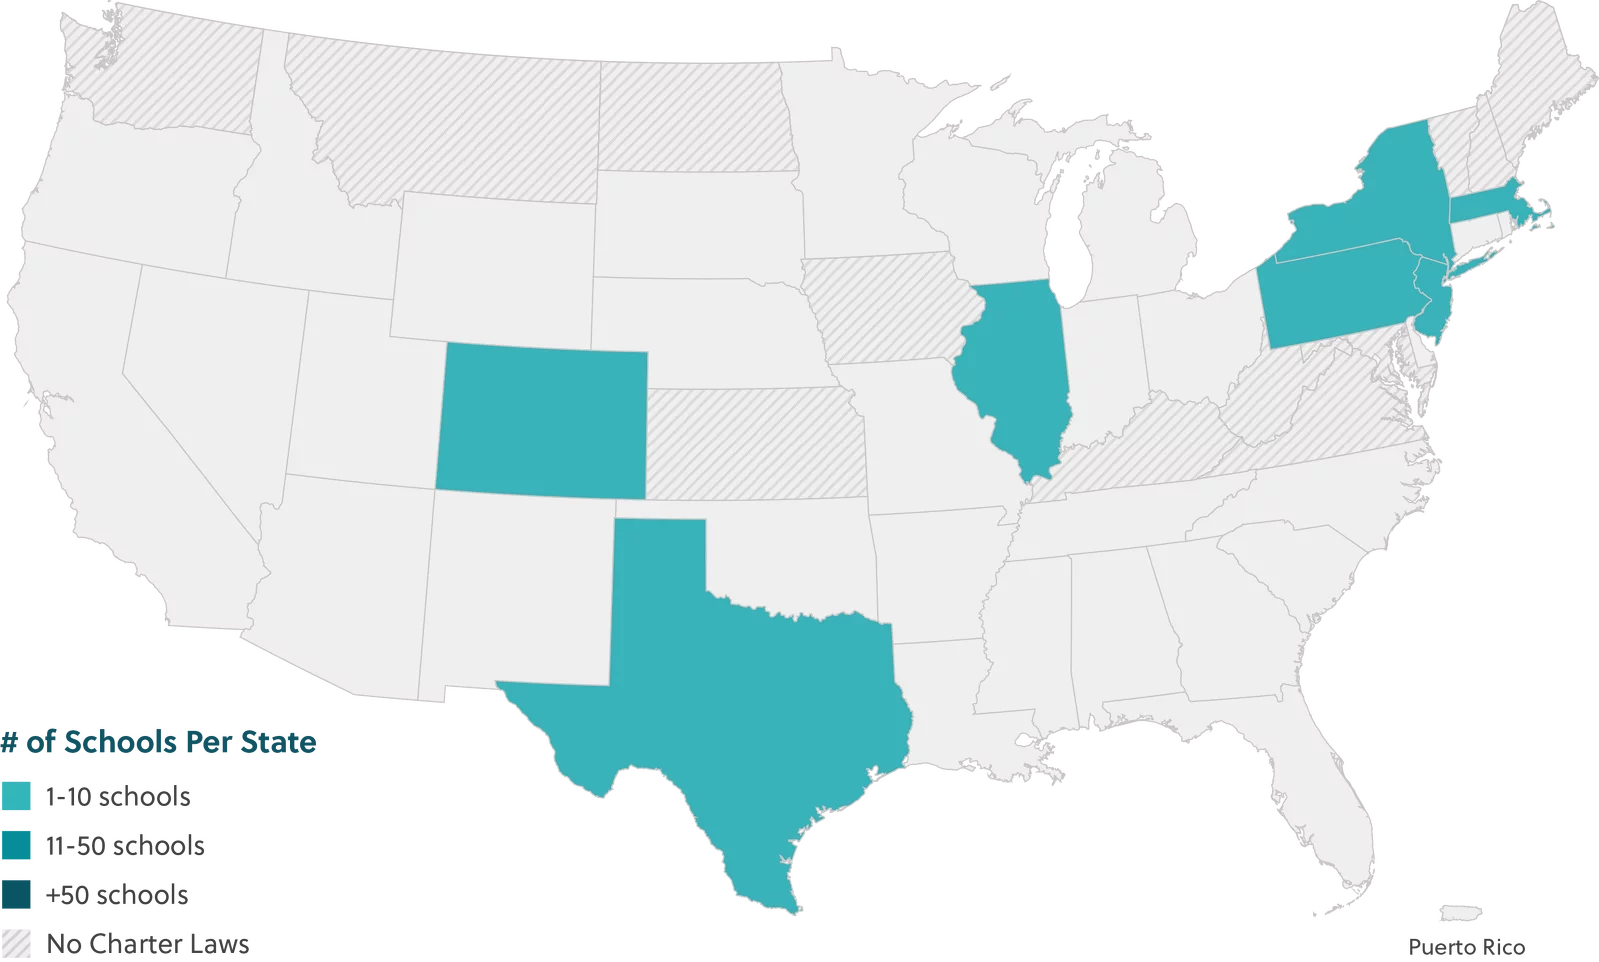
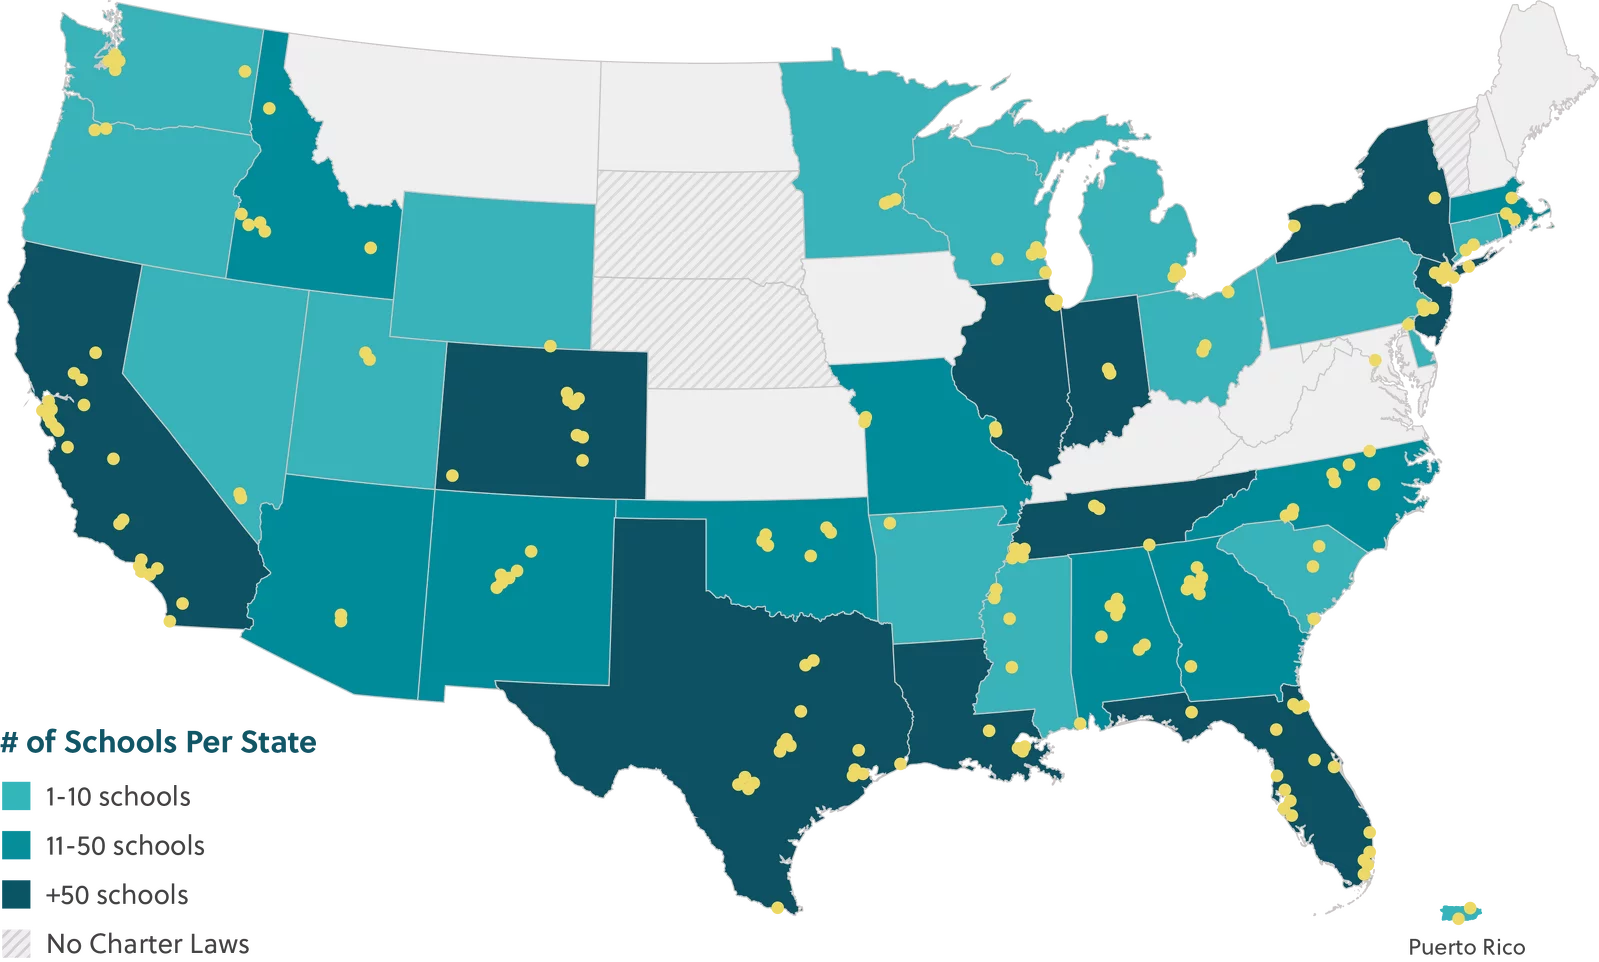
Compare Growth
Our Results
We monitor portfolio network performance across several domains including growth, academic performance, financial sustainability, and student demographics.
If CSGF portfolio schools were considered a single school district, it would be the nation’s second largest.
The CSGF portfolio serves a comparable percentage of students from socio-economically disadvantaged backgrounds.

Based on publicly available enrollment data for the 2024-25 school year
835K
students
Students Served
The charter schools to which CSGF has provided capital served 835,000 students in 2024-25, 76% of whom are from socioeconomically disadvantaged backgrounds and 80% of whom identify as Latino or Black.
55
new schools
New School Openings
CSGF portfolio networks opened 55 new schools and served ~10,000 more students in 2024-25 than in 2023-24.
100K
additional students
New Capacity
In 2025, CSGF made commitments that will enable high-performing charter networks to serve more than ~100,000 additional students in the coming years. Commitments made since the start of Fund IV will enable portfolio networks to serve ~256,000 additional students in total.


We believe all students, especially those from underserved backgrounds, deserve access to a high-quality education to realize their full potential.
Absolute proficiency rates across the CSGF portfolio, 2024-25

~45%
CSGF schools
Performance Relative to All Schools
Nearly half of CSGF-supported elementary and middle schools had a higher proficiency rate than the average school in their states.
91%
of graduates
Planning post-secondary pathways
91% of graduates of CSGF-supported high schools planned to matriculate to college, a credential program, or the military in 2025.
Investment Summary
CSGF made more than 300 new grants, loans, contracts, and mission-related investments to 250+ different organizations in 2025.
Not included are grants and loans associated with launching The Dell Catalyst Fund in partnership with Equitable Facilities Fund (EFF).
Letter from our CEO and President
 What makes an organization built to last? For CSGF, the answer lies in an unwavering commitment to excellence. For 20 years, our portfolio has helped raise the bar for the charter sector, and the numbers tell a compelling story: in 2005, our portfolio served about 20,000 students. Twenty years later, the networks we support have grown to serve about 835,000 students – 40 times as many students – nearly 90% of whom are students of color and approximately 75% from low-income families. We are inspired by this incredible growth in scale and impact, and we remain steadfast in our belief that sustainable public charter school networks can realize outstanding student outcomes at scale.
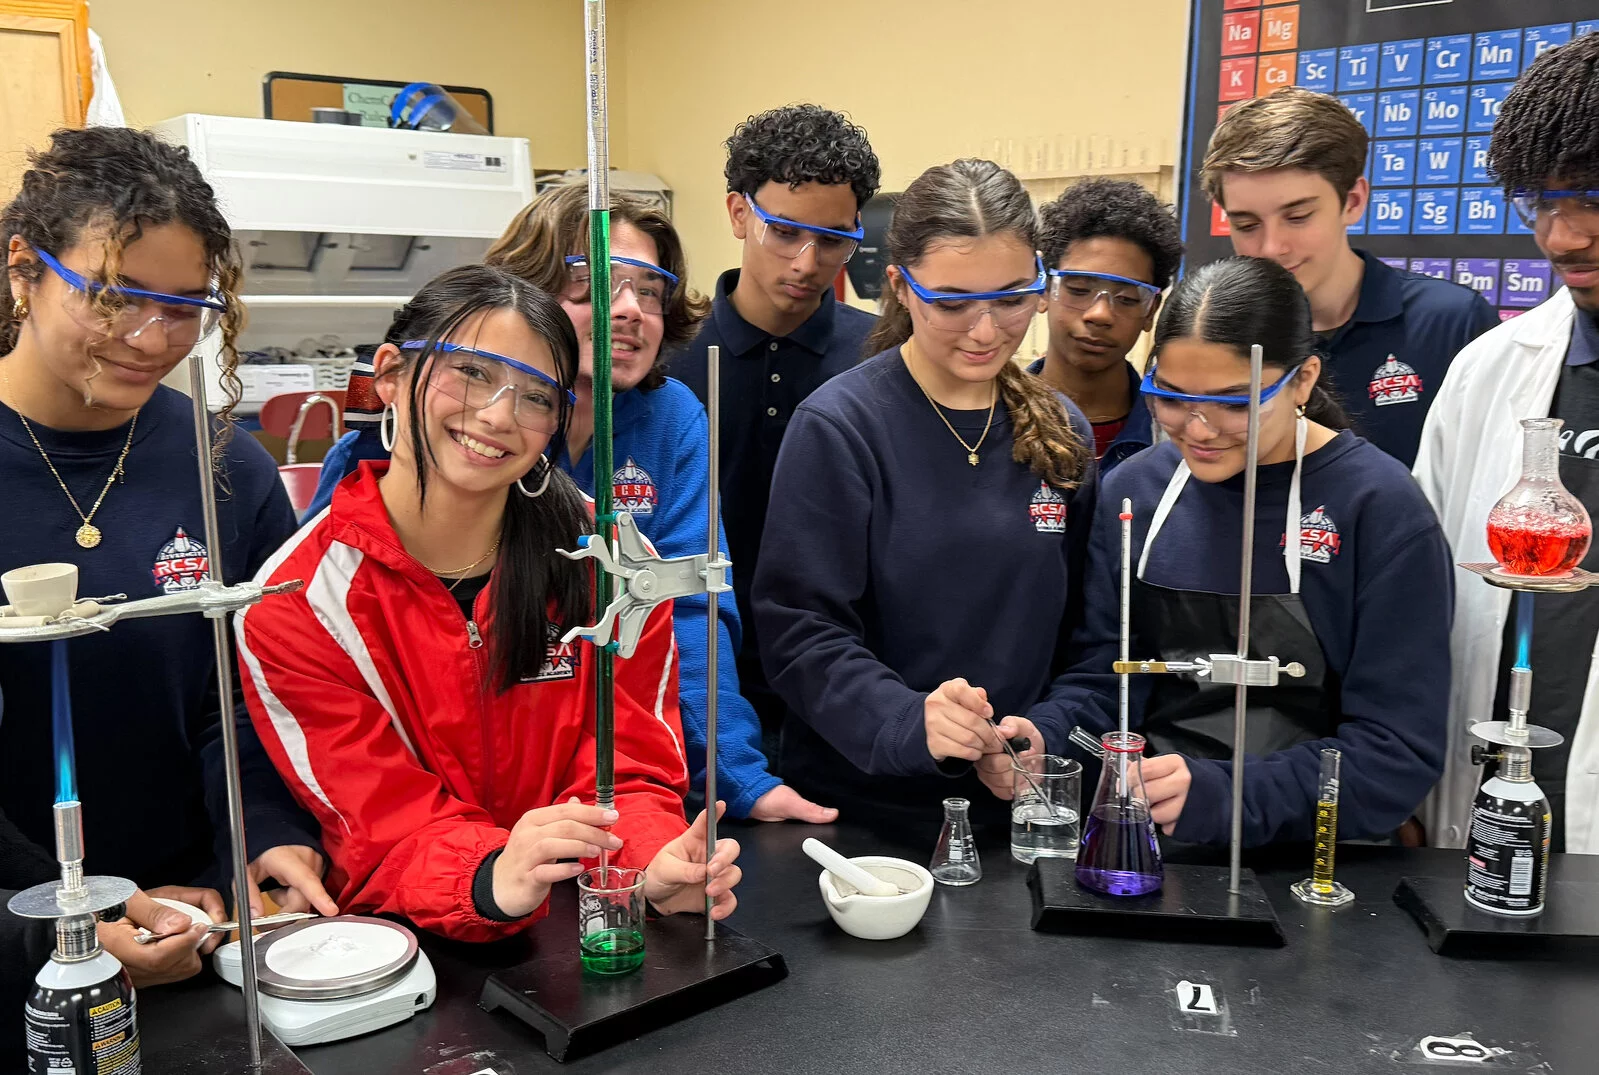
Fueled by this conviction, in 2025, CSGF made the largest number of new commitments in a single year in our history. Many of these investments reflect our commitment to supporting proven leaders as they scale. For example, we deepened our partnership with Zeta Charter Schools, a network that is outperforming 99% of schools serving socioeconomically similar students in New York. Zeta is scaling to reach an additional 5,000 students over the next five years through strong teaching practices and an inclusive, welcoming culture for both adults and students. We also made first-time investments in networks that are launching new phases of growth, including River City Science Academy (RCSA), which started in 2007 and became the first charter in the Jacksonville area to receive an “A” rating from the Florida Department of Education. Their expansion to eight schools will bring hands-on STEM programming to even more students over the next three years.
Building high-quality schools for the long-term requires both disciplined scaling and entrepreneurial responsiveness. I Dream Big Charter School received funding and support from CSGF to open their first school in the 2025-26 school year. What began as a STEM-focused summer enrichment program had such an immediate impact that founder Angela Lang built a full school, which now serves as a lab school for Stillman College, an HBCU in Tuscaloosa, Alabama. This kind of community-driven solution exemplifies the innovation happening across our portfolio.
Sustaining impact over time also requires continuous improvement. At CSGF, we strive to amplify proven practices and promising ideas, and build communities among leaders in our portfolio to help them navigate key inflection points as they grow. In 2025, we partnered with the Burning Glass Institute to research alumni career trajectories and long-term outcomes by analyzing degree attainment, earnings, and economic mobility to generate actionable insights for the field. We also expanded our High School Data Collaborative, which has grown from a small group of networks into a nationwide community of over 350 high schools across 25 states. Participating networks share data, benchmark performance, and connect to learn from one another and build the kind of collective intelligence that makes every school stronger. And as AI opens up new frontiers in education, we’re proud to support schools like KIPP NorCal, which is using AI to deliver personalized content to targeted student groups — freeing teachers to provide intensive support where it’s needed most, with early results showing up to 75% of students outgrowing comparable peers in reading fluency.
As we look toward our next ambitious goal — reaching 1.4 million students by 2035, nearly doubling our current portfolio — we do so with conviction born from 20 years of evidence that this approach works. When talented entrepreneurs set a clear vision and build a culture where students and educators thrive, they create something with the power to transform not just individual lives but entire communities. To achieve this vision, we will begin raising capital for Fund V in 2026, and we look forward to sharing more about our strategy as we embark on this next chapter together.
Thank you for your steadfast belief in this mission and in the remarkable leaders who deliver exceptional results for students every day.
With deep gratitude,

Kevin Hall, CEO

Darryl Cobb, President


Board & Donors
CSGF’s impact would not be possible without the insight of our board of directors, the generosity of our donors, and the bold visions of our portfolio networks.